US PUBLIC SCHOOLS: A TALE OF ECONOMY, ACCESS, AND OPPORTUNITY
Written by Jason DaWayne Smith
We’ll take a layman’s look at public schools today, through the lens of BDads in an effort to provide some insight on 3 key areas:
Current statistics on volume of public schools, who attends these schools, trends in attendance
Public school funding
Success rates of black children within the public school system and considerations
How’s that? Not too scholarly, but we have some good source data that certainly helped make me a bit sharper on the topic and I hope will do the same for you.
The great majority of the US population attends public schools and attendance is projected to grow. Overall US Sentiment towards US public schools appear to be positive.
55.6M kids attended school in Fall of 2018, with 50.7MM in public schools or 91% of all kids in the US attending public school. Here’s the breakdown by race:
24.1MM = White
7.8MM = Black
14MM = Hispanic
2.6MM = Asian
.2MM = Pacific Islander
.5MM = American Indian/Alaska Native
1.6MM = Of 2 or more races
Of the public school students, 35.6 million will be in prekindergarten through grade 8 and 15.1 million will be in grades 9 through 12.
Total public elementary and secondary enrollment is projected to increase between fall 2018 and fall 2027 to 52.1 million.
Using 2010 data from the US Department of Education - 8.1MM black students attended public schools vs. 431K in private schools and 488K in charter schools.
The percentage of high school dropouts among 16- to 24-year-olds declined from 10.9 percent in 2000 to 6.1 percent in 2016 (source). Reflecting the overall decline in the dropout rate between 2000 and 2016, the rates also declined for White, Black, and Hispanic students.
A Phi Delta Kappan poll suggests that most Americans fairly consistent rates of satisfaction, with roughly 70 percent of parents giving their children’s schools an “A” or “B” grade each year the question has been asked.

Using Chicago as a sample, the overall funding story for public schools doesn’t look bad, but when examined on a district and income level, there are noticeable gaps.
Public school systems will employ about 3.2 million full-time-equivalent (FTE) teachers in fall 2018, such that the number of pupils per FTE teacher—that is, the pupil/teacher ratio—will be 16.0.
Current expenditures for public elementary and secondary schools are projected to be $654 billion for the 2018–19 school year. The current expenditure per student is projected to be $12,910 for the 2018–19 school year
The Center for Tax and Budget Accountability ran an analysis of the proposed budget funding for the city of Chicago, vs the actual funding receipt by using Illinois new K-12 public school funding formula called Eviddence Based Model or (EBM). At a high level, the analysis discovered that individual schools were underfunded by $2.435 billion in FY2017. The table below shows CTBA’s projected Adequacy Target for all CPS schools ($5.740 billion) compared to the FY2017 Ending Budget ($3.305 billion). Overall CPS schools reach 57.6 percent of their Adequacy Target.

I actually got a bit nerdy and parsed through the full report, which can be found here and looks at funding gaps for every single public school in Chicago. What I found was rather troubling.
Furthermore, a July WGN report looked at a recently proposed $7.9B CPS budget and found that while comparing data from 36th Ward (predominantly Black and Hispanic ward on Chicago’s west side) and 47th ward (predominantly White ward on Chicago’s North side) where the mayor is from, there is a big difference. The 47th ward has a total of 60 percent of total needs met, compared to the 36th ward with only four percent of total needs met. So even within the total undermet budgets of Chicago schools, there still appears to be an economic divide of distribution.
To further dive into this disparity, we took a look at WBEZ’s 2019 Capital Plan data on city school funding by side of town and race. While the data is troubling we must remember that In every state, though, inequity between wealthier and poorer districts continues to exist. That’s often because education is paid for with the amount of money available in a district, which doesn’t necessarily equal the amount of money required to adequately teach students.


When examining success rates within public schools for Black children, we didn’t find any overt racial attachments, but discovered a troubling set of data that suggests a true segregation of race and wealth that implicitly limits success opportunities for Black children in public schools.
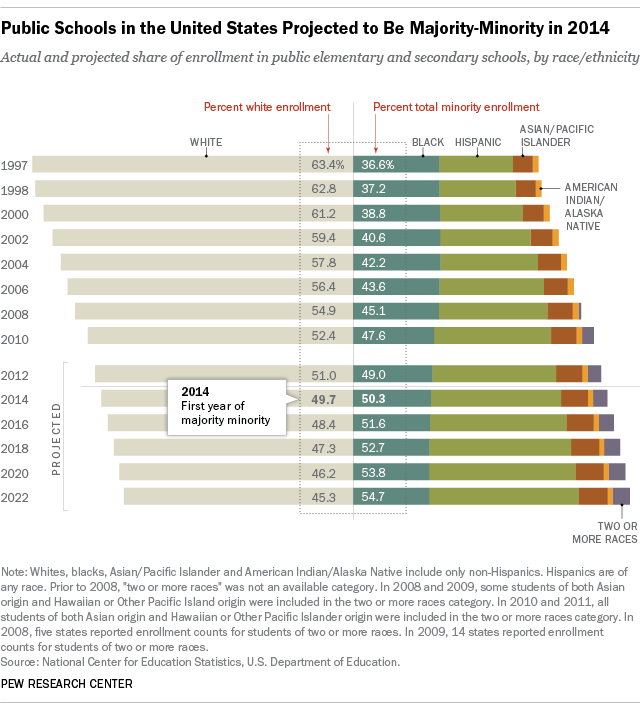
White students became the minority group within public schools as of 2014. In this year, the number of public schools where minority students comprised at least 75 percent of the student population enrolled 30% of all public school students, compared to 24% in 2004. - with Black and Hispanic students having the highest rate of attending public schools in which minority students comprise more than 75% of all students (+60%). In contrast - less than half of Asian students (38%) and only 5% of white students attended attended public schools where 75% or more of the student population was of minority background (source).
Same data source shows that roughly 20% of all black 25-29 year olds who’ve attended public schools have completed a bachelor’s degree or higher vs. 60+% for Asian/Pacific Islander and 40+% for white as of 2015 (source).
Where is this disparity coming from?
According to Atlantic magazine data in 2016 - in almost every major American city, most African American and Hispanic students attend public schools where a majority of their classmates qualify as poor or low income. One of the most severe effects of poverty in the United States is that poor children enter school with this readiness gap, and it grows as they get older. Children feel alienated from society; suffer insecurities because of their socioeconomic status; fear the consequences of their poverty; endure feelings of powerlessness; and are angry at society’s inability to aid in their struggles.
Children from lower-income families are more likely than students from wealthier backgrounds to have lower test scores, and they are at higher risk of dropping out of school. Those who complete high school are less likely to attend college than students from higher-income families.
Kids of color represent a majority of the student body in 83 of the 100 largest cities. In all but three of those 83 cities (Honolulu, and Chula Vista and Fremont, in California), at least half of them attend a school where a majority of their peers are poor or low-income. In 58 of those cities, at least three-fourths of non-white students attend majority low-income schools.
The experience for white students, who now represent a minority of the public school student body nationwide, remains very different. Figures are available for whites in 95 cities. Only in 35 of them (or almost 37 percent) do most white students attend schools where a majority of their classmates qualify as poor.
So while this isn’t an explicit race discrepancy, we see that because many Black and Hispanic students live in high poverty areas + attend schools that are highly contentrated with other high poverty students and students of their own race + live in areas with lower tax contribution to their public school, which limits overall funding for their school (only 8-9% of school funding comes from US government, the rest is mostly local) public schools are mostly a tough option for many Black kids success. Nationally, high-poverty districts spend 15.6 percent less per student than low-poverty districts do, according to U.S. Department of Education. Lower spending can irreparably damage a child’s future, especially for kids from poor families. A 20 percent increase in per-pupil spending a year for poor children can lead to an additional year of completed education, 25 percent higher earnings, and a 20-percentage point reduction in the incidence of poverty in adulthood, according to a paper from the National Bureau of Economic Research. The Atlantic wrote a great article on the topic and can be found here.
Conclusion:
Whoa, that was a lot. Again, we’re not experts, but we see that there isn’t an overall problem with public schools per se. The US is the largest public school system in the world. While we didn’t cover global implications, the volume of students eligible for public school access definitely represents a positive option for parents in this country and overall, most parents seem to be happy with their choice.
Where the story gets tricky is based on economy. Public schools are becoming more and more segregated, less white children attend. Public funding does not adequately account for lower income tax contributions to their local schools which results in poorer resources and results for lower income students, not because of skills but truly because of separation from white counterparts and birth within lower income contributing areas of their city.
The data simply suggests a closer look at the funding history, diversity makeup, and resource access of the public schools you have access to. It’s not always that easy, but this is a step. We won’t see the days of busing return, we won’t see wealthier families moving into lower income neighborhoods. The options are 3 fold:
Strong at home and extra-curricular support to balance school attention
Advocacy for city, state, and US funding support to balance contributions to lower income schools
A closer look at “school choice” - how can extended school options help broaden opportunities for students born in economically disadvantaged areas
We’ll continue our series with a look at charter schools later in the week. Our next and most logical step in finding the best school options for kids that may not have the economic means.